An initiative of the Robert Wood Johnson Foundation
Interview/Q&A

Deeper Dive: New Obesity Rate Data for Youth Ages 10 to 17

Published

November 5th, 2018

Share

The Health Resources and Services Administration’s National Survey of Children’s Health includes a wide range of data on the health of children ages 0 to 17. Among other topics, the survey provides obesity rates for youth ages 10 to 17. The newest iteration, which combines data from the 2016 and 2017 surveys, was released in October. Some key findings include:

Nearly one in six youth nationwide has obesity. The national obesity rate for youth ages 10 to 17 is 15.8%.

There is a wide range of variation in obesity rates at the state level. Mississippi has the highest rate, at 26.1%, while Utah has the lowest, at 8.7%.

Racial and ethnic disparities in obesity rates persist. Nationally, black youth have the highest obesity rate (22.5%) followed by Hispanic youth at 20.6%, white youth at 12.5%, and Asian youth at 6.4%.
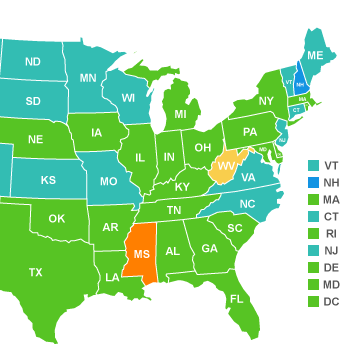
To learn more about the data, we asked a few questions to Dr. Lydie Lebrun-Harris, a senior social scientist in the Office of Epidemiology and Research at the Health Resources and Services Administration’s Maternal and Child Health Bureau (HRSA MCHB). HRSA MCHB funds and directs the annual National Survey of Children’s Health.

Question

What do these new data tell us about youth obesity rates in the United States?

Dr. Lydie Lebrun-Harris

In the big picture, the new data reinforce that childhood obesity remains a significant challenge for the country. Obesity puts young people at risk for a host of serious, long-term health consequences, like heart disease, diabetes, high blood pressure, and even certain types of cancer. Seeing that one in six young people in the country has obesity reminds all of us that we still have a long way to go to truly turn these rates around.

Question

How much have things changed since the last time the data were collected? What can we learn about trends?

Dr. Lydie Lebrun-Harris

The new data released this month combined results from the 2016 and 2017 national surveys. Results from the 2016 survey were released a year ago, and in that short timeframe the vast majority of states showed stable obesity rates. Only one state, North Dakota, saw a statistically significant change in its rate from 2016 to 2016-2017, which dropped from 15.8 percent to 12.5 percent.

Prior to conducting the National Survey of Children’s Health in 2016, it was significantly redesigned, including major changes to the way the survey data were collected. Therefore, it’s not possible to compare the 2016 or 2017 results to earlier years of the survey. In other words, 2016 acts as our new baseline for any examination of trends, and right now we can only compare data from 2016 alone to 2016-2017 combined. We’ll have to wait for additional years of data to see whether the decline in North Dakota continues, or if we start to see shifts in other states’ rates.

Question

What are some of the strengths of the data from the National Survey on Children’s Health? Are there any limitations?

Dr. Lydie Lebrun-Harris

A major strength of the survey is that it provides not only national data, but state-by-state data as well. In many instances, it’s also possible to examine differences by race and ethnicity at the state level. The full dataset also includes many other factors relating to children’s health and health care, their families, and communities so there is a rich depth of information available for conducting detailed analyses. In addition, as of 2016, the survey will be conducted every year so we will have up-to-date data to track trends in obesity.

One drawback is that the obesity data are based on parents’ reports of their child’s height and weight. The height and weight are not directly measured. In addition, it is not possible to obtain obesity rates for younger children under the age of 10. This is because research has shown that parents tend to underestimate height for children younger than 10 years, which leads to inaccurate obesity classifications.

Question

What should people do with these new data?

Dr. Lydie Lebrun-Harris

The data can help all of us, including those working to improve health at the state level, get a clearer picture of where we stand in our efforts to combat childhood obesity. By taking advantage of the newest data, policymakers at all levels will be better able to advance strategies to help all children achieve and maintain a healthy weight. People who are concerned about this issue can also use these data to get a better sense of how their state is doing in this effort.